.png)
MY ROLES(S)...
-
UX/UI Designer
-
UX Researcher
PROCESSES
-
Product Analysis
-
Competitive Analysis
-
User Interviews
-
Wire-framing & Prototyping
TIME PERIOD
-
1 week (2022)
THE CHALLENGE...
The Golden Nugget Online Casino & Sportsbook have recently expanded their range of sports offered within their sportsbook, one of them being Chess.
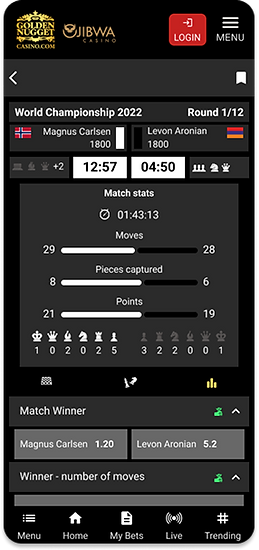
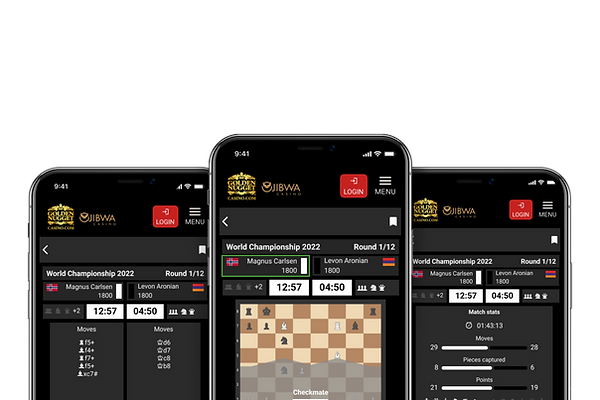
They want all sports offered to include an in-play match visual scoreboard so that users feel more engaged and have a better overall experience whilst on their website.
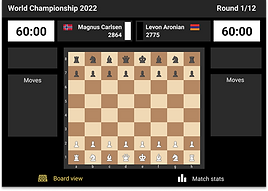
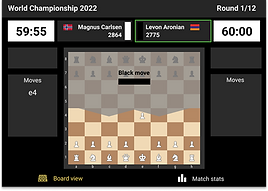
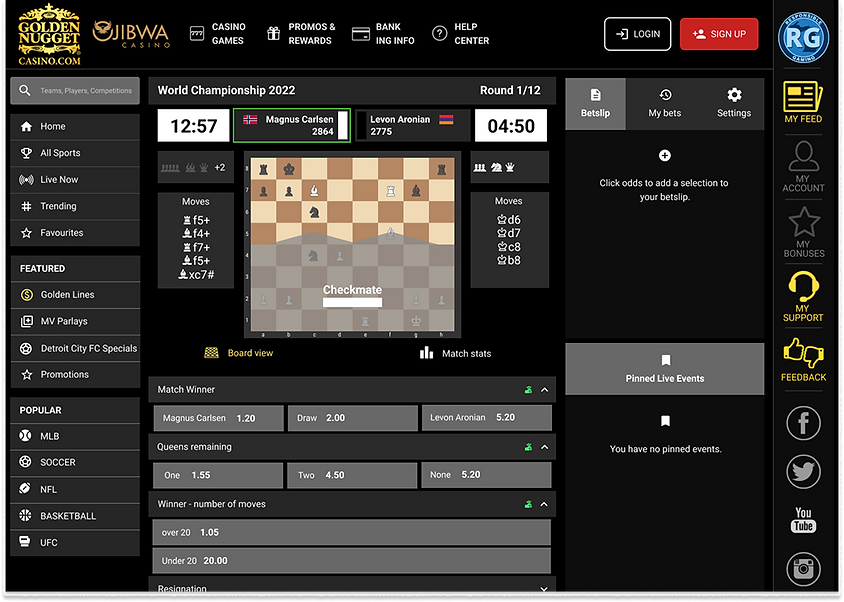
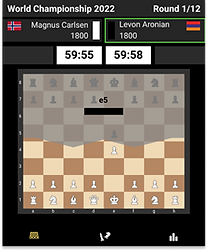
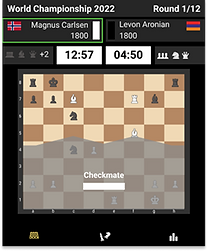
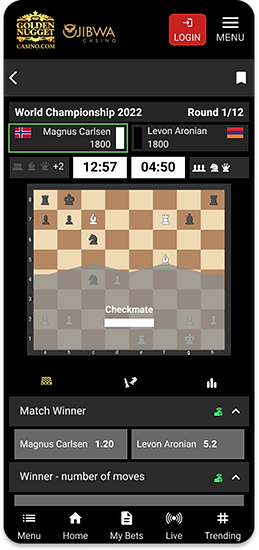
Create a visual in-play match scoreboard for the sport of Chess.
TOOLS
-
Figma

01 - the discovery phase
WHAT IS IN-PLAY MATCH VISUALISATION?
Bettors generally want to be as close to the action as possible, ideally they’d like to be pitch, court or track side of whatever sport their betting on, but of course this isn’t always possible. So what’s the next best thing?
Watching a LIVE stream is next best, but again this isn’t always possible either. The user might have a poor internet connection, the sportsbook might not have legal rights to show the stream or maybe there just isn’t one available.
So in order to simulate for the user, the feeling of being at a live sport event or watching it on TV, the next best option is a graphical visualisation of the event.
Here the user can get a good idea of how the event is playing out through the visuals displayed, e.g. in a football match they can see when a team is attacking or defending and get a general idea of where on the pitch the action seems to be happening. Along with the visuals, there will also generally be a set of live stats on the event, which again help the user know more about what’s happening.
Keeping bettors close to the action with up-to-the second live data helps them make quick and more informed betting decisions.
So whether it's live ball tracking in football, detailed in-play tennis, basketball, and cricket statistics at a team and player-level, it’s all aimed at helping the user make better betting decisions with real time data and give them a more intuitive, engaging and enjoyable experience.
Of course there is also the view from the bookmakers perspective, if the user feels more engaged on their sportsbook and is enjoying their time, they will stay longer and this will help drive daily active users and revenue.

I knew from my previous experience of working in the betting & gaming industry that these match visualisations and data feeds are usually provided by specialist companies. Companies like Stats Perform and Sportradar, they provide the data, live stream feeds and statistical information that we see on the sportsbooks via integrated APIs, widgets, iFrames etc.
So let’s take a look at how some of the popular betting companies have integrated these visual features into their sportsbooks. Below are 3 different examples...
COMPETITOR & PRODUCT RESEARCH
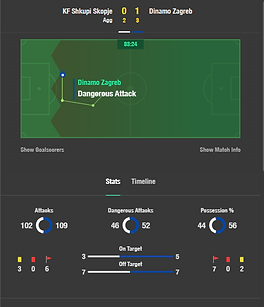
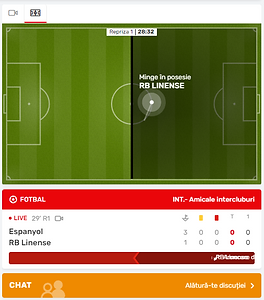
Bet365 & Superbet have gone with very minimal approaches.
-
Live graphical display of the event, including ball tracking
-
Option to switch to the LIVE stream (if available)
-
Basic in-play stats relevant to the sport displayed
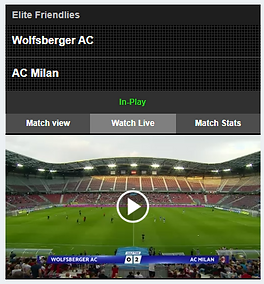

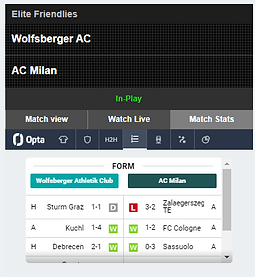
Betfair has improved on the previous examples by including a much more detailed stats area, by using an Opta data feed.
As you can see from the images the amount of match data offered is MUCH more detailed and also includes historical data, perfect for the bettor who uses data to make their decisions.
-
In depth stats section via data feed (e.g. Opta)
-
LIVE match feed option
-
A more attractive, hi-fidelity match visual
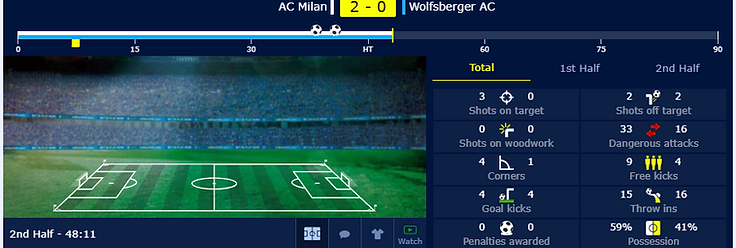
William Hill has employed a good all round approach.
They have attractive arena visuals and depending on the popularity of the event, some pretty good stat options available, without the use of a data feed like Opta.
02 - USER RESEARCH
From my previous industry experience and personal interest in sports betting, I have a pretty good idea of what a user would want to see visually on a scoreboard and also feature wise in regards to most sports, an in-play football match for example.
Plus, from all the product and competitor research I did in section 2, I have a good idea of the basic look and functionality required.
But, for a new and unknown sport like Chess, I’m not so sure! Here’s where I need to do some user research and speak to some actual Chess fans, who know the game and would have a good idea of what data and visuals would be useful in this situation.

Research Goals
-
Find out what pre-game & in-play aspects of a game of Chess are most important to a player
-
What are important events during a match (e.g. compared to a goal in football)
-
What kind of player stats would be useful to see and their importance (e.g. form)
-
What kind of match stats would be useful to see and their importance (e.g. amount of cards in football)
-
What would be the best way to visualise this information
-
Also, to generally help me understand more about the game, as I’m not an active player
How will I do it?
I shall be conducting a user survey that will hopefully extract the above information, I will then be able to analyse the results and using this data I can decide how to approach my design process.
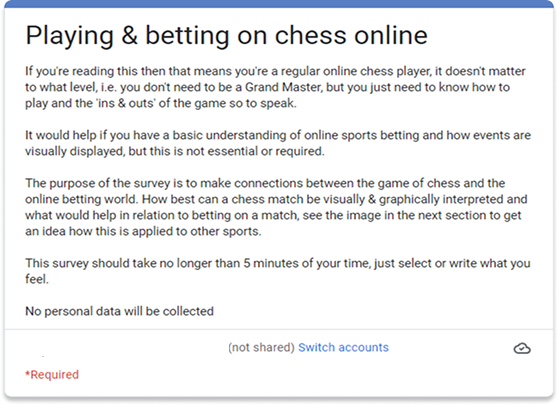
• Participant Scope - I surveyed in person, 1 very active Chess player at a decent national level, who reguarly plays online and in tournaments. They then shared the survey with fellow chess fans.
After having completed product, competitor and user research I wanted to get some product requirements defined, this will assist me when designing my wireframes and hi-fidelity screens as I can easily refer to my list of requirements and check them off against my designs.
FUNCTIONAL REQUIREMENTS
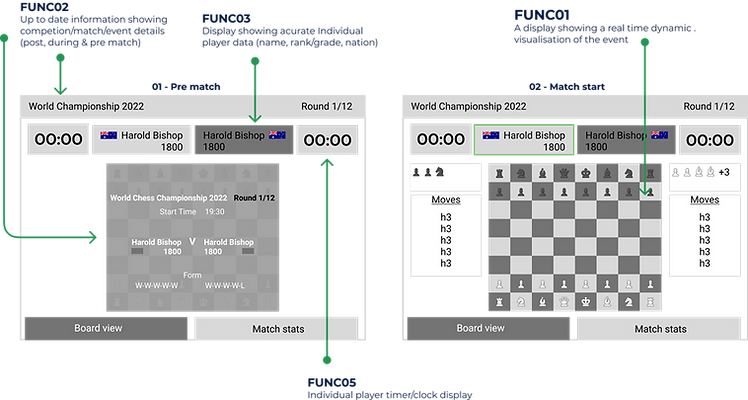
FUNC01 - A display showing a real time dynamic visualisation of the event
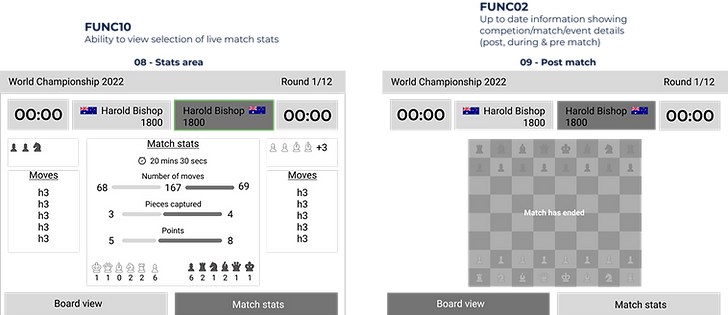
FUNC02 - Up to date information showing competion/match/event details (post, during & pre match)
FUNC03 - Display showing acurate Individual player data (name, rank/grade, nation)
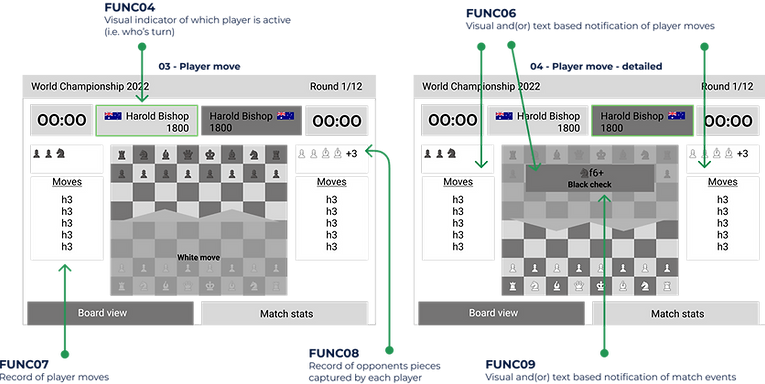
FUNC04 - Visual indicator of which player is active (i.e. who’s turn)
FUNC05 - Individual player timer/clock display
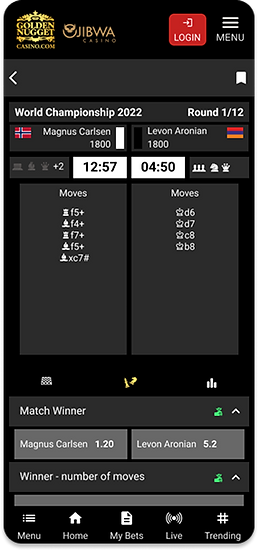
FUNC06 - Visual and(or) text based notification of player moves
FUNC07 - Record of player moves
FUNC08 - Record of opponents pieces captured by each player
FUNC09 - Visual and(or) text based notification of match events
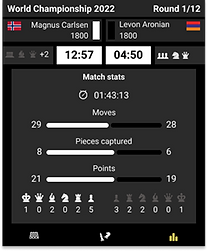
FUNC010 - Ability to view selection of live match stats (match time, player moves, pieces taken, points)
NON-FUNCTIONAL REQUIREMENTS
SYS01 - Responsive layout to whatever device
SYS02 - Accesible, needs to be usable for all users no matter their capabilities
SYS03 - Reliable, data displayed needs to be real time and up to date
SYS04 - Usability, user should be able to navigate between different areas
SYS05 - Secure, safeguarded against deliberate and intrusive faults from internal & external sources
SYS06 - Efficient, feature should be able to handle capacity throughout, including response times